
LOS ANGELES — Homeowners eager to sell may have to wait a while before a buyer comes along.
As of April, the U.S. housing market had nearly 34% more sellers than buyers shopping for a home, according to an analysis by Redfin.
Aside from April 2020, when the COVID-19 pandemic brought the economy and home sales activity to a standstill, there haven't been this few buyers in the market for a home before, based on records that date back to 2013.
The trend is good news for home shoppers — if they can afford to buy at current mortgage rates and prices, which are still rising nationally, albeit more slowly.
Fewer buyers means less competition for home listings and more pressure on sellers to dial back their asking price and make other concessions to help get a deal done. That's a stark reversal from just a few years ago, when it wasn't uncommon for homeowners to receive offers well above their asking price from multiple home shoppers.
People are also reading…
"The balance of power in the U.S. housing market has shifted toward buyers, but a lot of sellers have yet to see or accept the writing on the wall," said Asad Khan, a senior economist at Redfin.

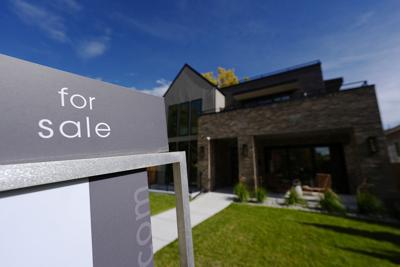
A for sale sign stands outside a home in the east Washington Park neighborhood of Denver.
Home sales remain in a slump
The lopsided balance between buyers and sellers is reflected in home sales, which remain in a slump going back to 2022, when mortgage rates began to climb from the rock-bottom lows they reached during the pandemic. Last year, sales of previously occupied U.S. homes sank to their lowest level in nearly 30 years. Sales fell this April to the slowest pace for that month going back to 2009.
Sellers began outnumbering buyers in November 2023, when the average rate on a 30-year mortgage climbed to a 23-year high of nearly 8%, according to mortgage buyer Freddie Mac. The average rate recently reached 6.89%, its highest level since early February.
All told, there were 1.9 million sellers and 1.5 million prospective homebuyers in April, or 490,041 fewer people in the market for a home relative to sellers. A year ago, there were 6.5% more sellers than buyers. Two years ago, buyers outnumbered sellers by 5.3%.
Redfin based its estimate of the number of sellers in April on active listings, or the number of homes for sale at any point during the month. It estimated the pool of people in the market for a home by creating a model that takes several other data into account, including the typical time it takes for a someone to buy after taking a tour of a home.

Some sellers lower prices, offer incentives
Faced with a market with fewer potential buyers, some sellers opted to lower prices or offer sales incentives, such as agreeing to pay for a buyer's closing costs or other expenses. Nearly 1 in 5 home listings had their price reduced last month, according to .
The growing imbalance between buyers and sellers should pull U.S. home prices 1% lower by the end of this year, according to Redfin.
Prices already began to decline in select metro areas. In the four weeks ended April 20, home prices fell in 11 of the top 50 most populous U.S. metro areas, including Dallas, Oakland, California, and Jacksonville, Florida, according to Redfin.
The market with the biggest gap between buyers and sellers is Miami, where sellers outnumber buyers by about 3 to 1, according to Redfin. The strongest seller's market is Newark, New Jersey, with 47.1% fewer sellers than buyers.
Despite tipping more in favor of buyers, the housing market is likely to remain unaffordable for many Americans. The median U.S. home sales price jumped 53% over the past six years, far outpacing wage growth.
While the inventory of previously occupied U.S. homes climbed last month to the highest level since September 2020, it's still well below pre-pandemic era levels and short on properties that most Americans can afford.
Before the pandemic, households earning $75,000 a year could afford to buy nearly half of all homes on the market nationally. As of March, only 21.2% of home listings were affordable, according to a recent analysis by the National Association of Realtors. A home is considered affordable if monthly payments don't exceed 30% of household monthly income.
"Without a significant boost in housing inventory at price points below $260,000," the NAR report said, "the path to homeownership will remain blocked for millions of Americans who are otherwise financially ready to buy."


Why has an entire generation been shut out of the housing market?
Why has an entire generation been shut out of the housing market?

In Idaho, homes have become 90% more expensive relative to income over the past decade. That's not a typo. A state once considered a haven of relative affordability is now one of the starkest examples of America's housing crisis. In 2013, home values in the state were a little over 3 times the median annual household income. By 2023, they had risen to 6 times the household income.
But Idaho is hardly an outlier. A new analysis from the real estate agency in collaboration with the research experts at finds that housing has become less affordable in 46 out of 50 states. In 18 states, buying a home is now at least 30% harder than it was 10 years ago.
Using data from the National Association of Realtors, Zillow, and the U.S. Census, the researchers took a deep dive into the U.S. housing affordability crisis, looking at which demographics and communities have been most affected.
![]()
A nationwide crisis

Affordability isn't just about the price tag of a home. It's about how much people are earning. In 2023, U.S. home values in every state were at least 2.5 times higher than the annual household income. In 16 states, home values were more than 5 times the annual income. This is a major uptick from 10 years earlier, when only two states—Hawaii and California—had ratios that high.Â
Even in states where affordability didn't get significantly worse, it's often because the home-to-income ratio was already bad in 2013 and it has simply stayed that way. For instance, home values in Massachusetts went from 4.9 times the annual income to 5.5 times. That means affordability only got 12% worse—a silver lining for one of the most unaffordable states in the nation.
The affordability crisis has spread across the country. Only three states (Alaska, Louisiana, and North Dakota) have become more affordable over the past decade, but all by less than 15%.
A case of bad timing (that has lasted decades)

Home ownership didn't suddenly become unattainable. The affordability crisis is the result of a series of economic circumstances and events that have compounded over time—a period of time that now stretches generations.Â
Today's first-time homebuyers are typically 38 years old, according to the National Association of Realtors. Back in 1981, they were 24 years old. That's nearly a 15-year difference.
Not only are first-time buyers older, they tend to make up a smaller share of home purchasers. Only 1 in 4 homes sold last year went to first-time owners. Back in 1981, first-timers made up close to half of all sales.
Older buyers make first-time home bids

It's hardly a wonder that there are so few first-time homebuyers—and that they are on the cusp of being middle aged—if you look at the economy and the real estate market over their lifetime.Â
A 38-year-old who purchased a home in 2024 was only 18 in 2004. That was right when home prices were beginning their explosive climb. Four years later, the crash happened. Home prices plummeted as the real estate bubble burst and took the rest of the economy with it. Today's 38-year-olds who attended college were graduating at the time, and were facing a dismal job market. What's more, many of them were saddled with student loans. Saving for a down payment felt unattainable.
By the 2010s, when the real estate market began to level out, the damage was already done. Many people of that generation had been shut out of the market.
Home prices continue to rise higher than wages

By the end of the 2010s, home values were on the upswing again, and when the pandemic hit in 2020, there was in the market. Homes were selling over asking price, resulting in bidding wars.
The problem for the same would-be buyers now is that higher interest rates have kept many current homeowners from selling. A recent from J.P. Morgan suggests that the situation won't improve until rates drop to 5%, which likely won't be the case for at least another year. With less inventory, prices continue to rise—and they are rising much higher than wages. The market is stuck. And so are the people trying to enter it.
The rental market isn't helping

As home ownership slips out of reach, many Americans are relying on rentals for housing. But rental prices are also extremely high compared to wages. According to , over 21 million households spent more than 30% of their income on rent in 2023. That's half of the 42.5 million renter households in the United States.
Some places have extremely unaffordable rental markets. In Miami, renters spend 40% of their income on housing. In New York, it's 38%, and in Los Angeles, 36%.
More than half of people who want to buy their first home say their existing living costs are too high and their incomes too low to afford a down payment and cover the closing costs of a purchase, according to a published in 2024. Another 18% also cited credit card debt and 10% cited student loan debt as obstacles that are keeping them from affording a home.
The result: People are continuing to struggle to set money aside for a down payment.Â
No easy fix
The data helps explain why the housing market feels so broken for so many people. If the past decade is any indication, there is a growing gap between what people earn and what homes cost. And while every state is different, the story is largely the same: Prices have surged, wages haven't, and fewer people can buy.
One way to alleviate the pressure in the market is to have more housing options available. Freddie Mac, which facilitates the mortgage market by buying mortgages and selling them to investors, that there was a shortage of 3.8 million housing units in late 2020. By 2024, that shortage still stood at a staggering 3.7 million units. States are actively trying to to build more housing, by revising zoning regulations, streamlining administrative processes, and incentivizing construction of more affordable housing options.Â
But the bottom line is that the housing crisis didn't happen overnight—and it won't be solved overnight either.Â
Methodology
To see affordability changes over time, the research team gathered historical data on incomes and home values by state. Median household income came from the U.S. Census Bureau and home values came from the Zillow Home Value Index (ZHVI) for single-family homes. The Zillow data was monthly, so the team averaged the months of each year for which data was available (typically, 12 months, except in 2020, which had less data due to the pandemic).
The team calculated the income-to-home-value ratio for each state in 2013 by dividing household income by the home value. They repeated that step for 2023. Finally, they measured the percent change of that ratio to show how affordability has improved or worsened in each state. If the change was within ±3%, the state was considered to be unchanged (equal affordability in both years).
originally appeared on , was produced in collaboration with , and was reviewed and distributed by Stacker.